How To Create Drill Down Dashboard In Tableau
This may be a very specific use case, but I actually have needed this technique twice in the past year. Once, so that a user could access a methodology/FAQ page from either of two dashboards and return to the one that they started on. The second time was so a user could drill down to a details page from either of two dashboards and, again, return to where they started.
Why is this functionality useful and what do developers do instead at times? First of all, from a user experience standpoint, if I were to click a button and it takes me to another dashboard, I expect to be able to quickly and easily go back to where I started from. Prior to developing this technique, I would put two navigation buttons on the drill down page (the lower level one) – one for each of the dashboards. This is a bit clunky because the user may not yet realize there are two paths to get to the one report and two, they now have to make a choice – do I want to go back to where I came from or do I want to "go back" to a dashboard I wasn't on at first. From a guided analytic framework, I don't think it makes a lot of sense to "go down" the report, then across. People can get easily confused with the navigation paths, so I think it's optimal to keep them simple and clear to your user.
Another solution is to have two duplicate drill down reports so that navigation from Dashboard 1 always goes to Drill Down 1 and back and Dashboard 2 always goes to Drill Down 2 and back. Neither would intersect. This works, but it's more maintenance as you have two of the same drill down reports just for the sake of navigation. Both of these solutions are not ideal for you or your user.
This tutorial blog, will guide you through how to create paths so that you can drill down from Dashboard 1 or Dashboard 2 to the Drill Down dashboard and when the user selects the "return" button, they will navigate back to which ever dashboard they initiated the drill-down from. Pretty cool, right? Well, I certainly think so!
Create Your Views
For this technique to work, you need two main views that drill down to a detailed view. You can check out this dashboard here, which was part of a TUG presentation, that shows you all the details. First, I created a view that allows a user to select a state (from the map) and obtain a detailed summary view for that state.

Next, I created a view that had a table for customers that would drill to the same view, but filter for the customer.

Both of these views drill down to the same analytic view.

Once you have all three views, we need to create a navigation pathway that will only be true for when you come from each view. Meaning, if you come from view 1 you can only get back to view one from the detailed report. You cannot get to view 2. In order to do this, we need parameters and a few simple calcs.
Set Up the Calculations
First, we need a parameter that is a simple Boolean T/F called "Return Parameter". Next, create a TRUE calculation and a FALSE calculation with only that text in the calculation and call them p.True and p.False.
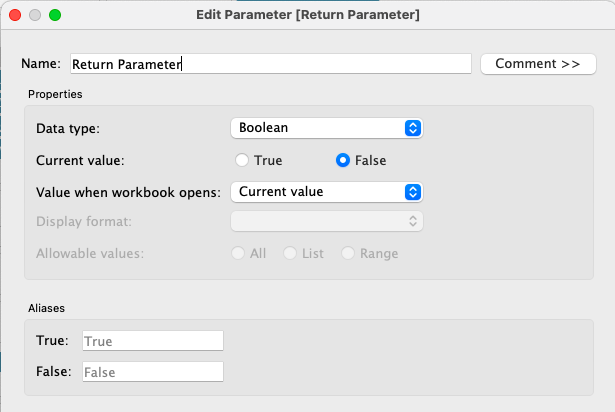
Next, create another calculation that simply has the "Return Parameter" value in it, called p.Return Button.
Okay, so we have our calcs, now we need to create two worksheets which will be the essential "buttons" to drive this action.
Return Worksheets
Create a worksheet that will be the driver to return to one of your dashboards. For me, I'm making a "Return to Overview" and a "Return to Customers". All I need is to place a double quotations on rows to create a blank sheet. Then place my p.True calculation on details. In case you are wondering, this will all be driven by parameter actions.
Set your mark to a shape and use a "blank" or transparent shape. If you haven't done that before you can check out this post or this one by my good friend Kevin Flerlage. I do this because I use custom backgrounds and float this worksheets over them. You could also use shapes. So do that if it's easier! Below you can see there is a blank shape (oh wait, you can't see it) and the single quotations I wrote in the Rows shelf, plus the p.True calc. Next, I placed the p.Return Button on filters and set to True. This means this worksheet will only population when the value is TRUE.
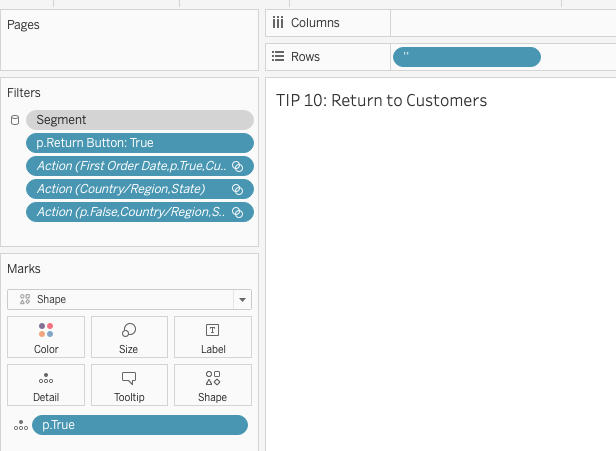
Next, I duplicate the worksheet and rename if for my other "return to" dashboard. The only difference? I add my p.False calculation to details and change the p.Return Button filter to False (you need to change the parameter to do this, or just select exclude instead).
Once we have both worksheets, which will act as our return buttons, we can set up our dashboards.
Hooking Up the Dashboard Navigation
On the detail dashboard (whichever is the dashboard that is the one that 2 more more will drill down to), add a container to your view and place the two "button" worksheets within it. Set them both to entire view. One should fill it up and one should be blank. In my case – I use a background image that appears to be a shape, which helps in the user experience. As mentioned earlier, I used blank shapes. Technically you could use a shape, as mentioned above.


On my drill-down dashboard, I now set up two "Go to Sheet Actions". For my "Return to Customers" worksheet – I have that worksheet return to the Customer dashboard. For my "Return to Overview" worksheet – I have that worksheet return to the Overview dashboard. These are simple actions that when you click on the worksheet, a user will be taken to the appropriate dashboard.
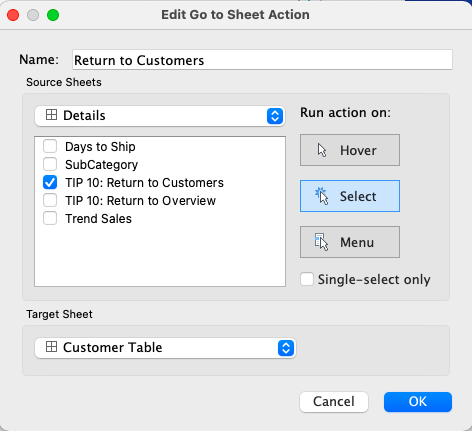
Okay, so that gets us back because each work sheet is only shown for when the p.Return Parameter is True or False, so your user will only ever be able to select one of the two. However, we need to direct the True or False based on the dashboard someone came from. So this is the important step.
Final Step – Setting up the "Where you came from" Part
On each of the dashboards that will drill down, I've added an action filter (filter the detail dashboard by state or individual customer) as well as a parameter action.
From the Customer dashboard, I created a parameter action with a source sheet of the Customer dashboard and a source parameter of the "Return Parameter" (remember, which is a T/F). The field will be the p.True field – remember that which ever worksheet you set up with the TRUE or FALSE calcs on detail will need that to be hooked up on the dashboard.
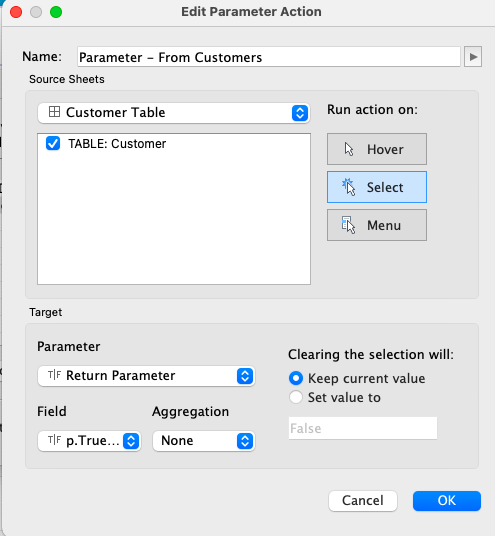
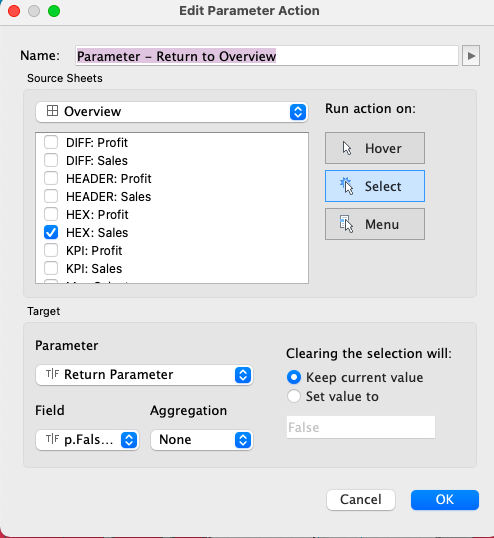
Essentially, when I'm on the Overview page and drill down – that sheet has triggered the parameter to change to FALSE, which only populates the "Return to Overview" worksheet to be true. That worksheet has the action to return to the Overview dashboard only, so it's the only button I have. Vice versa, when I am on the Customer page and select a customer, it drills to the same detail page, but again, the parameter action triggers to change it to TRUE, thus only populating the "Return to Customer" worksheet, which has a action to return me to that dashboard.
Final Thoughts
A small note – This ONLY works when tabs are hidden. This is because if you navigate to the Details dashboard, nothing has been triggered to select or change the parameter. So this is best used for when you have a custom user experience that includes navigation but no tabs in Tableau.
Here is a video of this technique in action. And as always, if you have questions, please reach out here or on Twitter (@ZenDollData). I hope this is helpful!
Cheers,
Lindsay
How To Create Drill Down Dashboard In Tableau
Source: https://vizzendata.com/2021/06/11/return-to-where-you-came-from-how-to-drill-down-to-one-report-from-two-places-and-get-back-the-source-dashboard/
Posted by: milsapmustrien.blogspot.com

0 Response to "How To Create Drill Down Dashboard In Tableau"
Post a Comment